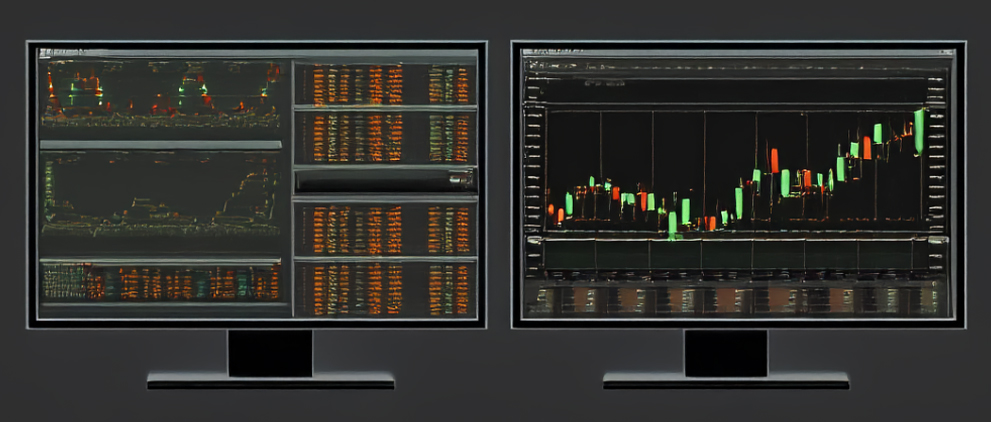
Navigating the stock market can feel like wandering through a dense forest without a map. That’s where technical indicators come in handy – they’re like the compass helping you find your way to successful trades. For both new and experienced traders, mastering these tools can make a world of difference in understanding market trends and spotting opportunities.
The basics are simple. Technical indicators are statistical calculations based on the price, volume, or open interest of a security. They help traders analyze price movements and forecast future patterns. These indicators can be grouped into two main categories: lagging indicators, which confirm trends, and leading indicators, which predict future price movements. A mix of both types can provide a balanced perspective.
1. Moving Averages
Moving averages are one of the most straightforward indicators that smooth out price data by creating a constantly updated average price. This tool helps traders identify the direction of the trend over a specific period, making it easier to spot potential buy-and-sell signals.
2. Relative Strength Index (RSI)
RSI measures the speed and change of price movements. It’s scaled from 0 to 100 and helps determine whether a stock is overbought or oversold. An RSI above 70 suggests the stock may be overbought, while an RSI below 30 indicates it could be oversold. This gives traders clues about potential trend reversals.
3. Bollinger Bands
These bands measure market volatility. They consist of a middle line (usually a simple moving average) and two lines that are standard deviations away from the middle line. When prices move closer to the upper band, a security may be overbought. If they move near the lower band, it might be oversold. Analyzing these bands can highlight possible entry and exit points.
Using these indicators isn’t about relying on just one. Instead, blending a combination can provide a more comprehensive understanding. The secret is finding which indicators align best with your trading style and goals. Keeping the emotion in check and focusing on what the data is telling you is key to leveraging these tools effectively.
This excitement about decoding market signals isn’t just for seasoned traders – it’s for everyone. And as you grow more confident using these indicators, consider joining our closed BETA to fine-tune your strategies and elevate your trading game. Happy trading, and remember to always trade with a plan.
– The Radium Team

